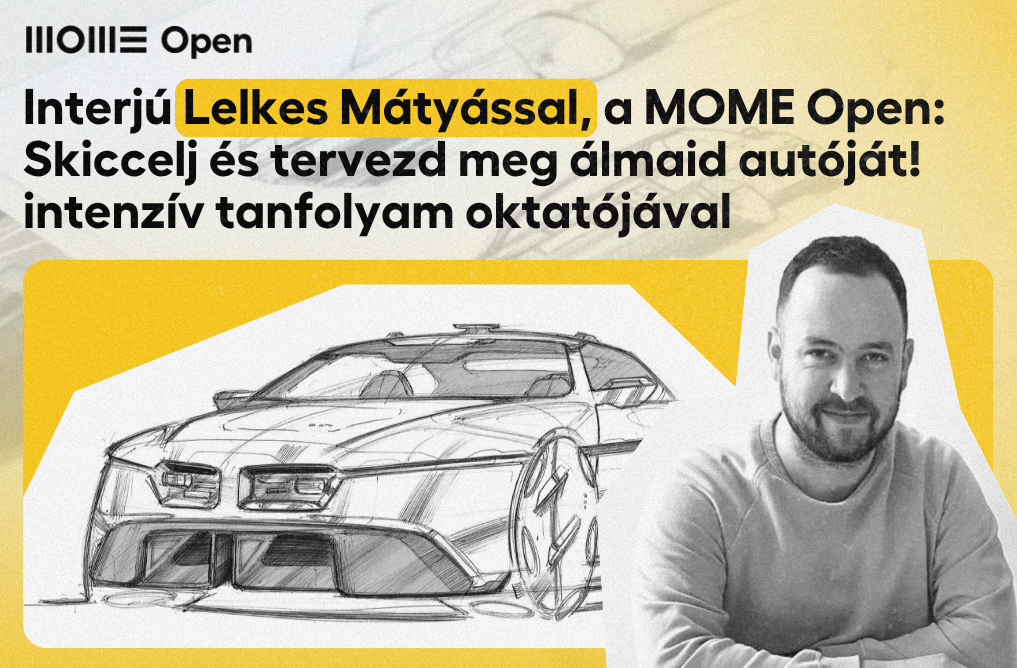
Lelkes Mátyás formatervező, a MOME Open Skicceld és tervezd meg álmaid autóját! intenzív rajztanfolyamának oktatója a közelmúltban a Blikknek adott interjút, amelyben a kortárs autótervezés aktuális kérdéseiről, a formatervezés jövőjéről és a kreativitás szerepéről beszélt. A 2024-ben MOME-n végzett formatervező tanulmányai során négy különböző Mercedes-koncepciót tervezett – később pedig a Mercedes-Benz Mobility Design Lab csapatában dolgozott 4 féléven keresztül, emellett a YT márkával együttműködésben egy elektromos enduro kerékpár koncepcióján is dolgozott. Csapatmunkában egy innovatív mentőhordágy koncepció fejlesztésében is részt vett, amelyet a MOME Formatervező Tanszék a 2024-es Red Dot Design Awardra jelölt, a díjat sikeresen el is nyerték. A Kecskeméti Egyetemmel közös együttműködés keretében elektromos versenymotor formatervezésében is közreműködött. Tervezői munkája mellett rendszeresen készít autótematikájú illusztrációkat, oktatóként pedig ezt a gyakorlati szemléletet és kreatív gondolkodásmódot adja tovább hallgatóinak. Az interjú egyik központi témája az volt, miért tűnnek egyre hasonlóbbnak a mai autók. Lelkes Mátyás szerint a jelenség hátterében nem a kreativitás hiánya áll, hanem a globalizáció, a felgyorsult információáramlás, valamint… Bővebben »