Our Data Storytelling Summer University is getting closer! During the four-day event, participants will learn from national and international data researchers and practitioners. One of them is Evelina Judeikytė, data storyteller and designer.
Evelina is an independent data storytelling and design specialist based in Paris. She is an information designer with almost a decade of experience in data and communication. She has worked at both large companies like Warner Bros. and smaller startups and organized TEDx events. She runs Parabole Studio, where they help mission-driven organizations communicate their impact through engaging data stories.
At Parabole, Evelina and her team’s work is a subtle marriage of the fields of data, communication, and design. They craft clear narratives that have just the right amount of design elements.
When did you start working with data visualization and data storytelling?
I’ve been working with data since the beginning of my career, and specialized in data visualization about five years ago. In parallel, I’ve always been passionate about rhetoric and communication, which is where the storytelling component of my work was born.
What made you decide to be a data storyteller and designer?
We’re often asked to choose between two worlds: the analytical one and the creative one. Data storytelling allows me to work and play at the intersection of the two, which is both fascinating and challenging at the same time. Never a dull day in my line of work!
You founded Parabole Studio in 2021, what is your company’s mission and vision?
Our purpose is to help mission-driven organizations communicate their impact through engaging data stories. We aim to help reduce inequalities in the world: be it in terms of education, financial resources, climate, or social support.
What does data storytelling and data communication mean to you?
To me, being able to communicate data effectively, ideally through stories, is the difference between a dry statistic that makes people yawn and a fun story at a party that everyone wants to listen to. Data doesn’t have to be all serious and boring, and storytelling and design can help achieve that.
Why is data visualization and data storytelling important in your opinion?
They’re useful and impactful both on an individual and a collective level. On an individual level, communicating data through stories and visuals can empower today’s professionals to present their work with confidence. Perhaps even more importantly, on a societal level, communicating data on today’s important topics – health, economics, war etc. – can make these topics accessible to all citizens and improve their understanding of the world.
Tell us about the project you’re most proud of and why.
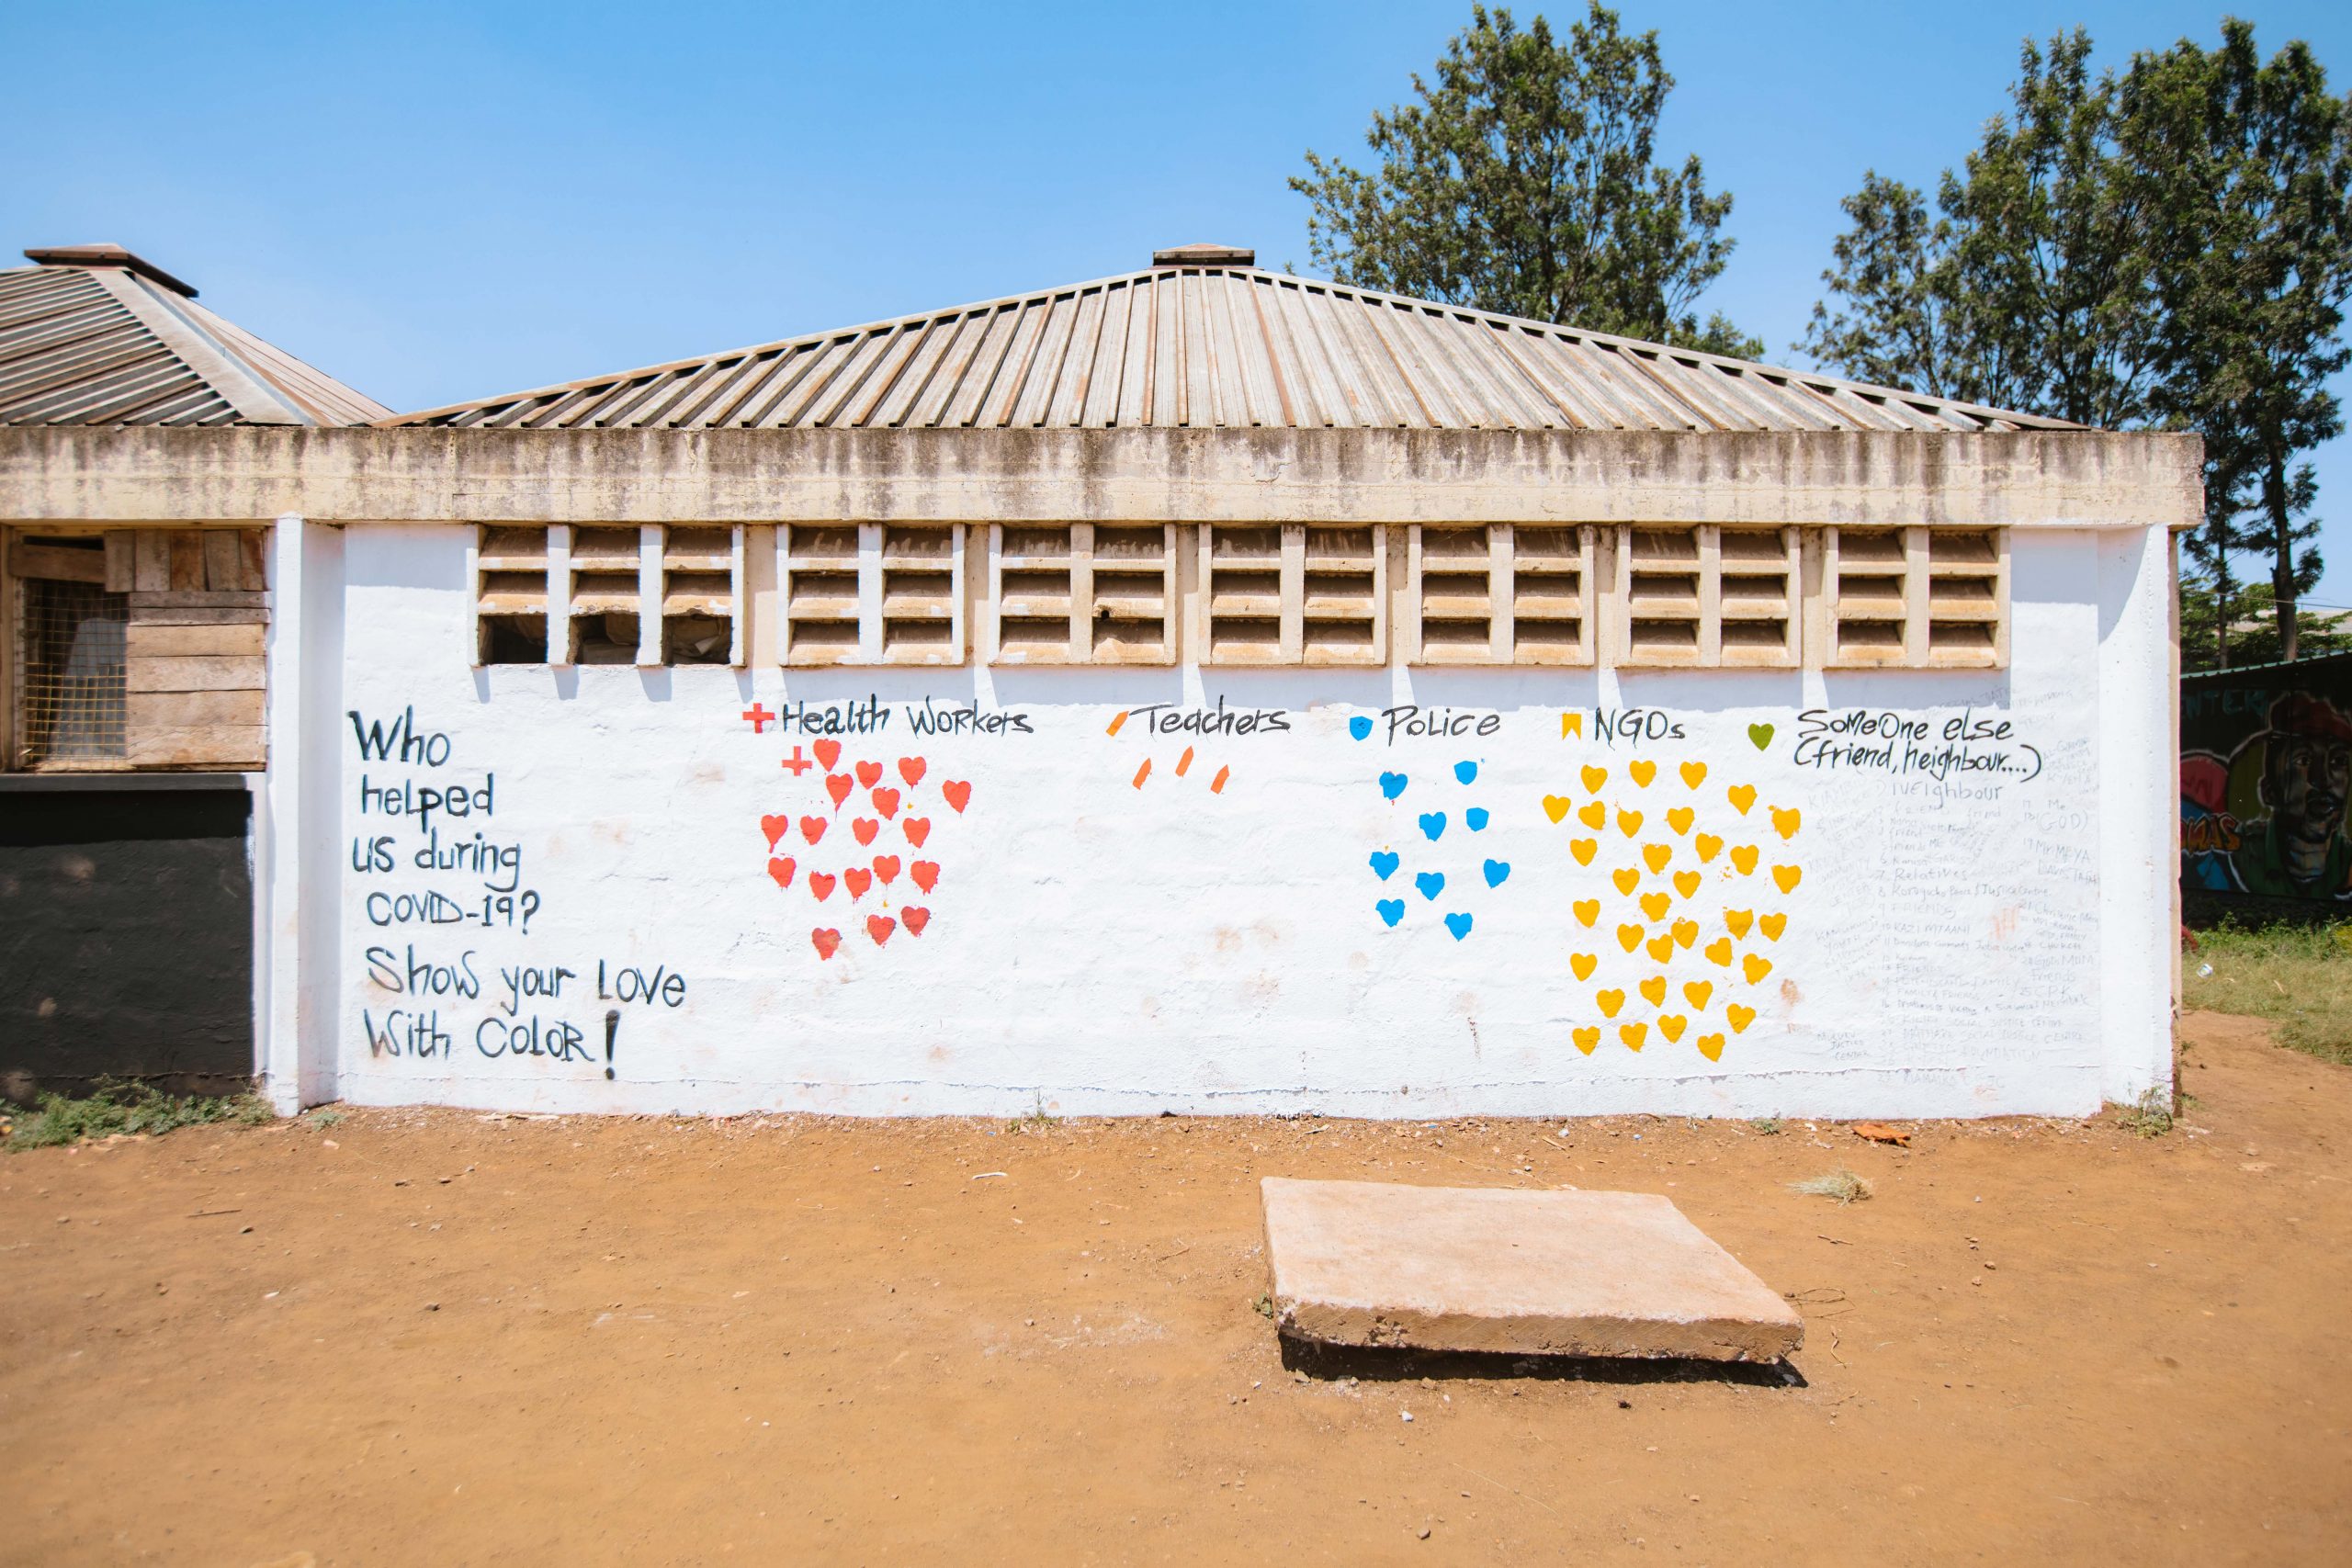
One of my favourite projects ever was one I worked on for Data4Change and the Social Justice Centres Working Group. The SJC is a community-led movement in Kenya focused on seeking justice and speaking out against human rights violations. They gathered data about the difficulties faced by their communities during the Covid-19 pandemic and curfews. We decided to share that data in an unusual way—by hosting an in-person data visualization event in the Dandora informal settlement in Nairobi. The end result was three dataviz murals for the locals to show solidarity, express their thoughts and grieve. It was such a unique and impactful local project!
Why is it useful to teach this topic in the summer university at MOME?
Data storytelling is a set of skills that can be extremely useful for almost anyone, but we rarely dedicate time to learn it throughout the work year. We’re always so busy! That’s why taking the time to upskill during the calm month of August is a great way to go about it.
Could you tell us how your workshop at the summer university is structured?
The workshop is divided into three modules. In the first module, we’ll work on finding data insights and structuring an engaging narrative from it. Then, we’ll move on to creating charts and graphs and design them to support this defined narrative. Finally, in the third and final module, we’ll practice techniques that help to effectively deliver the data story in a presentation. Each participant will work on an actual dataset throughout the workshop.
Who do you expect to attend the summer university? What prior knowledge is required?
Anyone working with data, really. You don’t need to be an expert in data analytics or visualization, but some basics are required. If you’ve never opened an Excel sheet or created a simple bar chart, you may want to practice that a little bit before coming to the workshop.
What are some of the problems or situations that could be answered or addressed by this workshop? What type of knowledge will participants acquire during the workshop and what will they be able to do, after completing it?
This workshop is good for people who are looking to:
After completing this workshop, they’ll have the tools and techniques needed to turn data into narratives that inspire action.
Which fields of work could benefit from this workshop, where data is used, and where it could be important to use it more creatively in the future?
Almost any field, actually. It may sound like a little much, but in the past, I’ve taught journalists, project managers, business people, researchers, marketers and so many more; sometimes in the same room! More and more roles now require the ability to communicate data effectively, and the skills taught in this workshop will be applicable to them all.
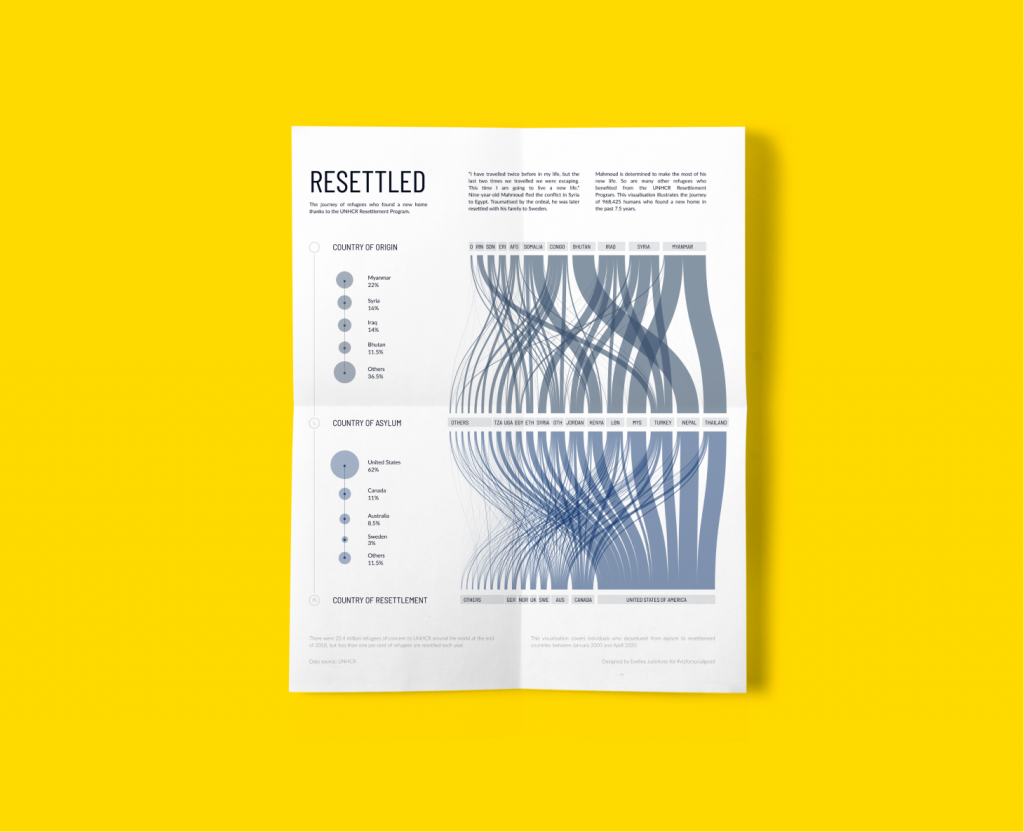
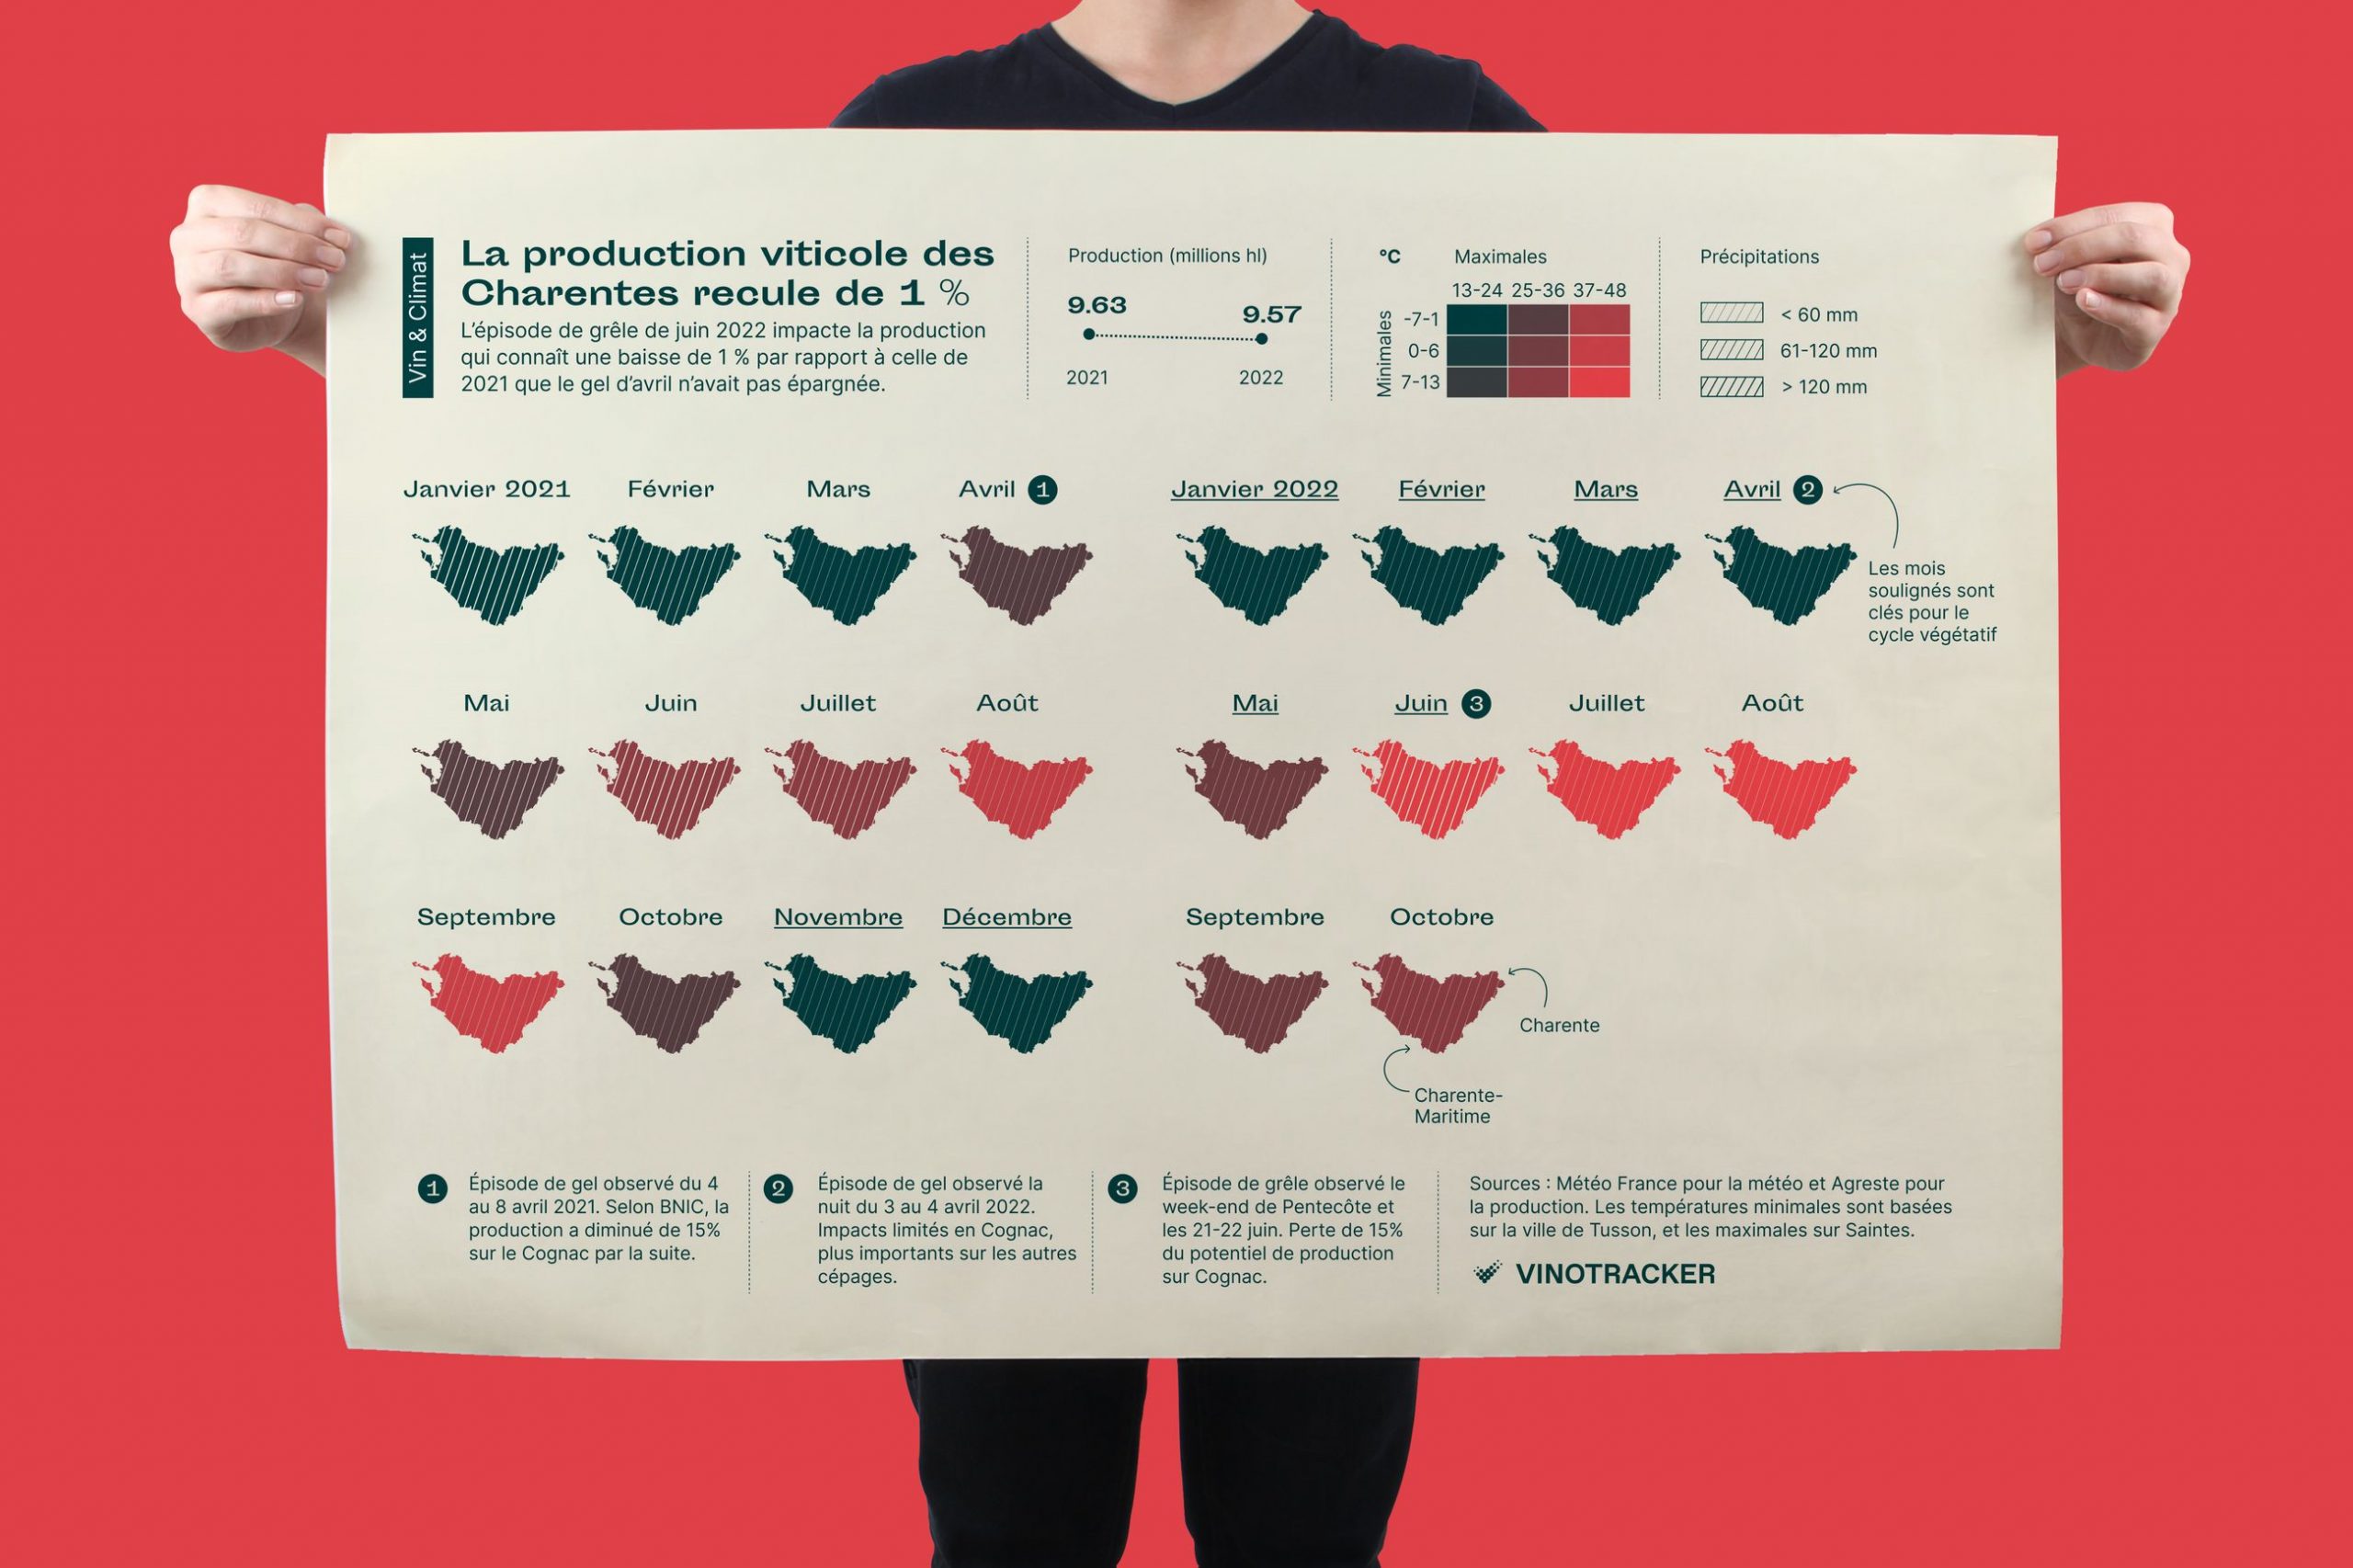
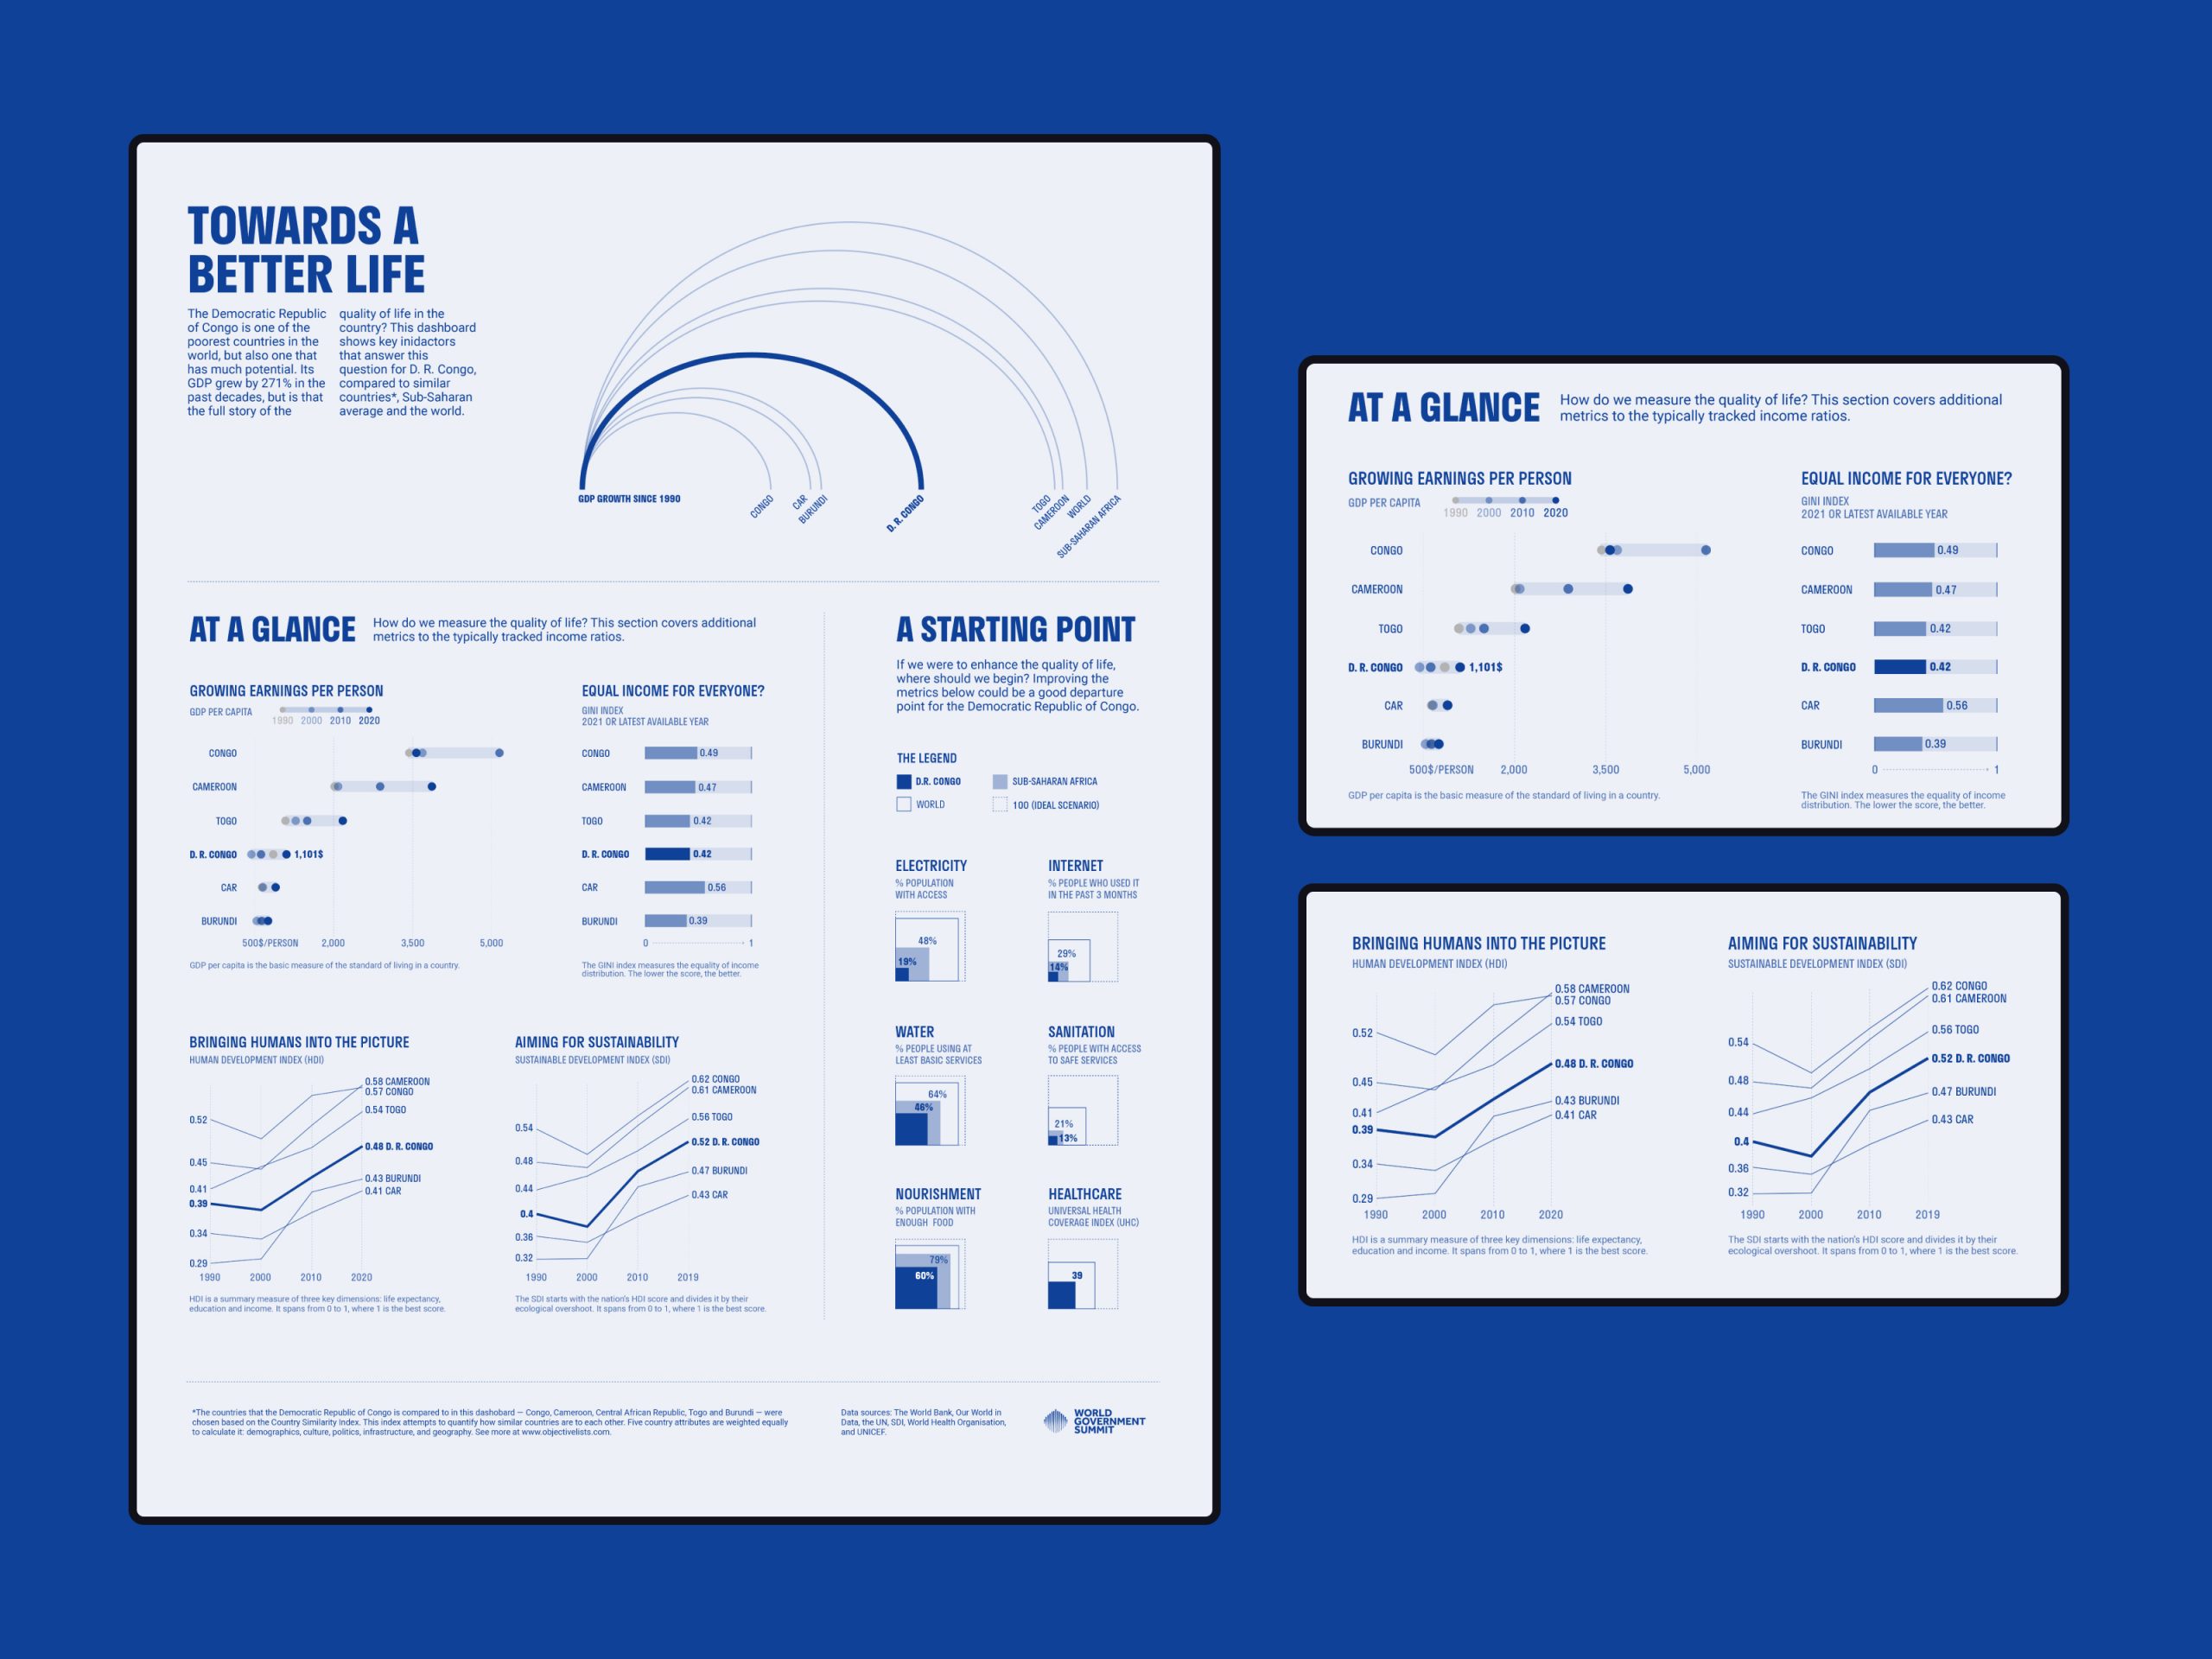
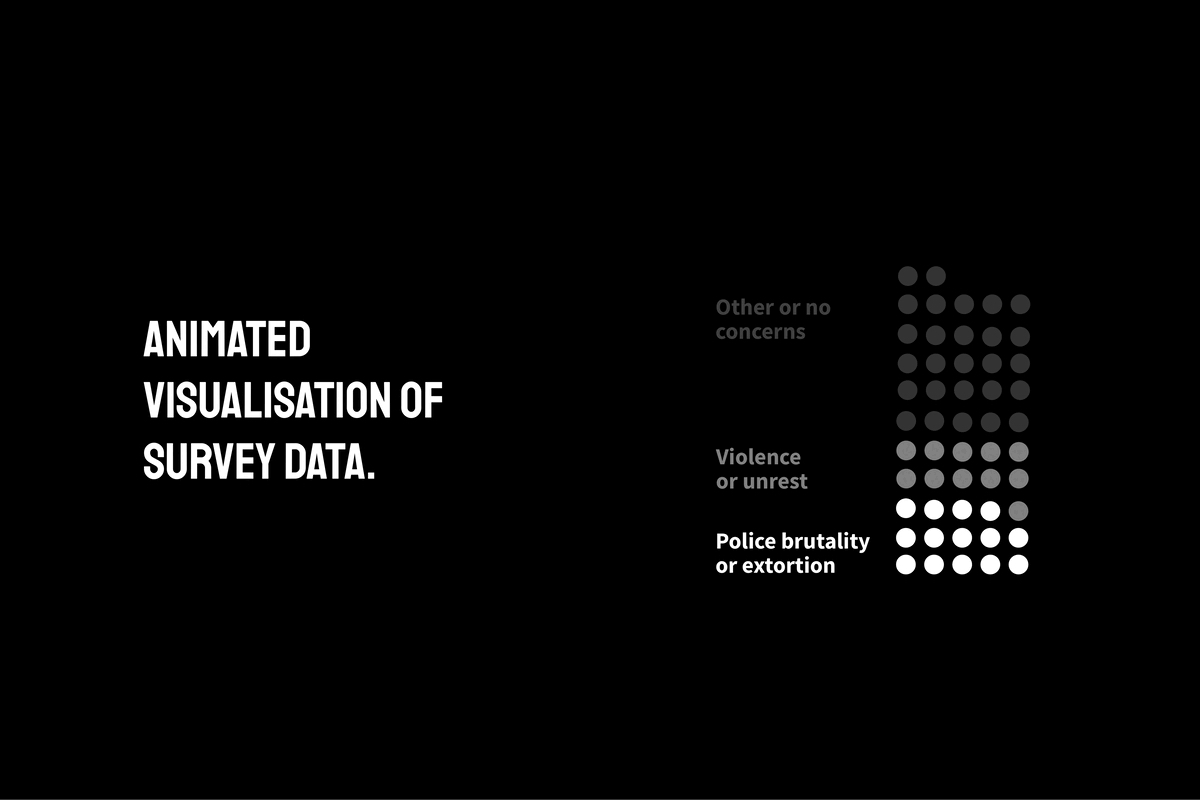
Photos: works of Evelina Judeikytė
Evelina Judeikyt: LinkedIn | Twitter
Did you know that you can attend our Data Storytelling Summer University, without paying for your travel and stay here? If you work at a university where Erasmus+ Mobility is available, the university provides your costs for travel and subsistence during your time abroad. You would only have to pay the participation fee. Get to know Budapest, have fun and learn at the coolest campus in the region for four days leading up to Sziget!
If you are interested, contact the international programme coordinator at your university.